td,dr: A1 800, A2 1500, B1 1500, B2 1700, B3 2400, C1 1900, C2 2100, C3 3000. You needed around 2000 rating to have a 50% prob of advancing to Round 2.
Hi everyone. GCJ round 1A took place yesterday. If you didn't participate, you may be wondering how hard it was, and what are your chances to pass round 1B or 1C to qualify for round 2.
I provide below my estimate of the difficulty of the problems. The data and methods are the same I described in my previous post. I am sure there is room for improvement, so again I welcome any feedback.
Method 1: The 50% Bucket
Approach and Data
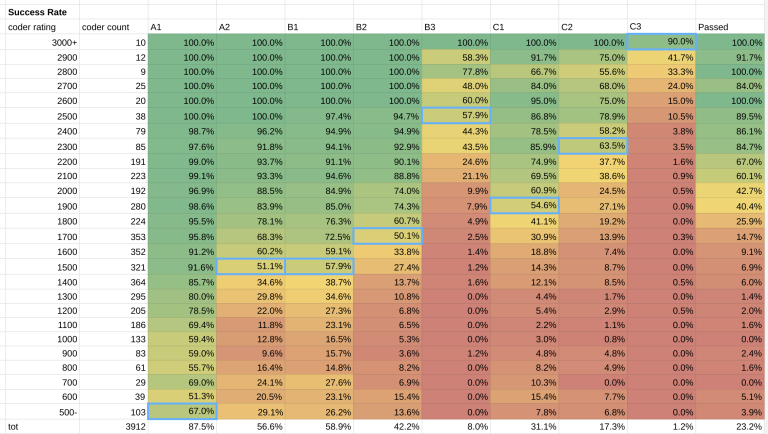
Please see my previous post for an explanation. In short, I divide the contestants into buckets of rating, wide 100 points, and I see which bucket had a 50% probability of solving the problem.
Out of around 10'000 participants of GCJ 1A, 3'915 had a CF namesake. I removed a few obvious outliers, and the results are below.

Results
This is the estimate: A1 500, A2 1500, B1 1500, B2 1700, B3 2500, C1 1900, C2 2300, C3 3000.
I think this approach is now working better than it did for the qualification round. One possible reason is that this time everyone tried to solve every problem, differently from the qualification round where there was little incentive to solve everything.
However, one problem persists: among lowly rated participants there are coders performing very well, maybe too well, for their rating. These may be new accounts of seasoned coders. The high percentage of low-rated coders who solved A1 shrank its estimated difficulty. Was it really a 500 difficulty problem? Maybe it was something more.
Method 2: Inverse Prob Function
Approach and Data
Again, please see my previous post for more details.
In short, CF rating system assumes that your chances of solving a problem are a function of your rating and of the problem difficulty, see here.
We can invert the probability function to estimate the problem difficulty: $$$D=400 \cdot \log_{10} \left( \frac{1-p}{p} \right) + R$$$
where $$$R$$$ is the rating of the participants I am considering, and $$$p$$$ is their probability of solving a problem, estimated with the percentage of participants who actually solved it, and $$$D$$$ is the estimated difficulty.
In this round, the average contestant rating was 1594. I used the rating buckets around the average, from 1500 to 1700. This includes about 1000 contestants.
Results
This is the estimate: A1 1154, A2 1529, B1 1505, B2 1689, B3 2299, C1 1825, C2 1981, C3 2804.
The results are fairly in line with the previous method, which is a good sign. The two biggest differences are these:
A1 has a much higher rating now, around 1100. My impression is that the approach of inverting the prob function doesn't work very well for difficulties far away from contestants' rating. I do some average between estimate methods to adjust for it.
C2 difficulty dropped from 2300 to about 2000. Which one is more accurate? My personal impression is that 2300 is a bit too much, but I welcome your input here.
My Estimate
I put together the two estimates above, and I get this:
A1 800, A2 1500, B1 1500, B2 1700, B3 2400, C1 1900, C2 2100, C3 3000.
What rating did you need to be to pass the round? Well, 43% of coders rated 2000 qualified for Round 2. The percentage increases to 60% for 2100 rated participants. You needed to be about a Candidate Master to have a significant chance to pass.
In the table above, right-most column, you can see the details.
What do you think?


