Update: Due to popular request, we created a script for you to generate your own rating profile. For detailed instructions, refer to our ui page on github. We plan to rewrite our code in Javascript to expand functionality, but hopefully this is helpful in the meantime. Please let us know if you have any suggestions!
This project was written jointly with yj12.
Several heuristics exist for finding suitable practice problems on Codeforces. One common piece of advice is to sort all problems by the number of solvers and to work down the list. However, the number of solvers depends on a number of factors, including the recency of the contest, and the date and time the contest was held. Another heuristic is to try to solve problems at a certain level, for instance, all Div. 1 C problems. However, the difficulty of such problems can vary greatly from contest to contest.
We decided to create a better measure of problem difficulty, which we’ll call “problem rating”. Problem rating is an integral value, with higher problem ratings reflecting harder problems. In order for the rating to be meaningful, we made it mathematically compatible with user ratings. Technically, problem rating is the rating of a hypothetical contestant such that his/her expected rank equals the number of participants who solved the problem. In practice, if you meet a problem whose rating is equal to your rating, you are expected to solve it in half of your contests. To give you some intuition into this number, say there is a contest with 10 contestants rated 2000. If 5 of those contestants solved it (and 5 did not), the problem would be rated 2000. If 7 solved the problem, it would be rated 1852. If 9 solved the problem, it would be rated 1618. For convenience, we give problems solved by all users a rating of 0 and problems solved by no users a rating of 5000.
Of course, there are some shortcomings to this approach. For instance, not all problems are equally attempted by all contestants during a contest; most of us are much more likely to attempt earlier problems than later ones. Furthermore, since users who don’t solve any problems don’t count as participants, our ratings are deflated, especially when the first problem of a problem set is difficult. These are issues we hope to address as we refine our ratings in the future.
We’ve provided a list of problem ratings at our github page. Instead of ordering by the number of people who solved each problem, you could personalize your list by practicing problems in a target range.
Do we actually get more points for solving harder questions?
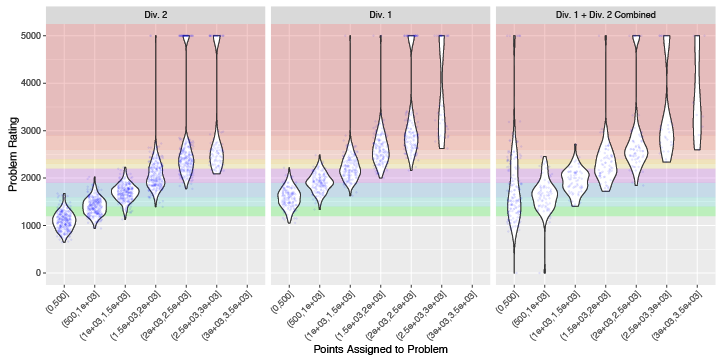
There is a clear linear relationship between the point value of problems and their rating, although there is a fair bit of spread for each point value. A Div. 2 500-point question could be as easy as gray or as hard as blue, and a Div. 1 500-point question ranges from gray all the way to yellow.
How stable are problem ratings and contestant ratings over time?
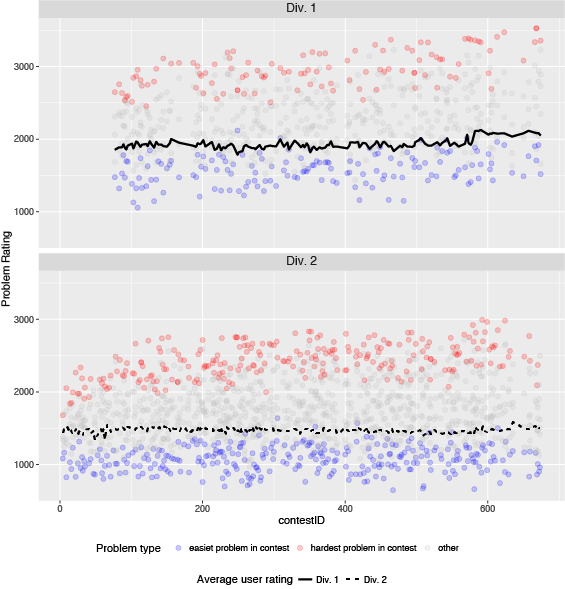
In this plot, each dot indicates one problem. The hardest problem in each contest is colored red, and the easiest problem in each contest is colored blue. Both the hardest and easiest problems in Div. 1 have been creeping upwards over time, while easy problem in Div. 2 have been more stable. The average rating of Div. 1 participants (solid black line) and Div. 2 participants (dashed black line) are rather stable over time, with a jump recently due to the recategorization of Div. 1 and Div. 2.
Which categories of problems are the hardest to solve?
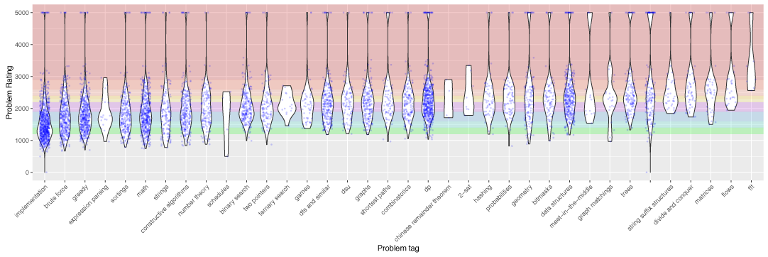
While it is difficult to categorize problems accurately with only a few tags, there are still some interesting patterns in the distribution of problem ratings with respect to problem tags. Categories here are sorted by increasing median problem ratings. There is a significant amount of spread within each tag. Unsurprisingly, problems tagged with “FFT” appear to be the most difficult, but are also infrequently seen. “Flows”, “matrices”, “divide and conquer”, and “string suffix structures” are next, followed by problems without any tags. “Implementation” and "brute force" problems appear to be the easiest, but still quite a few did not get any solves in-contest.
Are problem ratings stable between divisions?
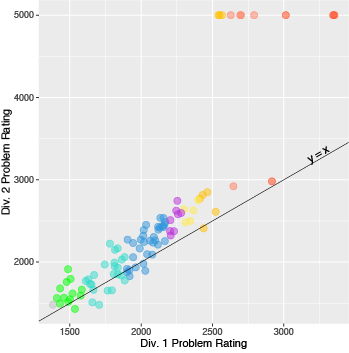
Since a few problems are shared between Div. 1 and Div. 2 contests, we decided to see how well Div. 1 scores correlated with Div. 2 scores for these problems. Here, each dot is a problem shared between two divisions, and they are colored by their Div. 1 ratings. We see a strong linear relationship between the two, and as expected, Div. 1 problem ratings tend to be lower than Div. 2 ratings. This is especially apparently in a few problems that are unsolved by Div. 2 participants but have been solved by Div. 1 participants. This pattern could be attributed to a number of different factors: very difficult questions are sometimes solved by no Div. 2 participants, and they also tend to see these problems later in the contest, leaving them less time to solve them.
What’s next?
Once we have a way of calculating the difficulty of problems, we can visualize a user’s rating trajectory superimposed on top of problems they’ve done either in contest or for practice. Here’s a profile of I_love_Tanya_Romanova, a long-time champion on the problemset leaderboard.
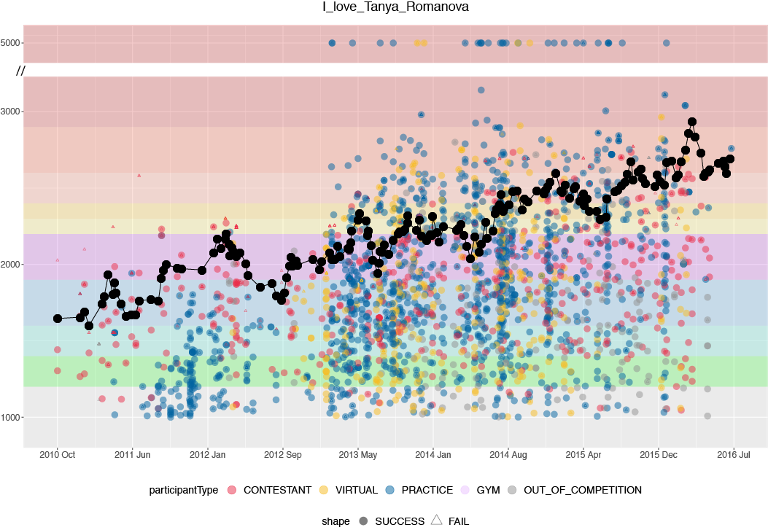
We hope that these visualizations can help us make predictions on how users can best improve their ratings. In particular, we're interested in finding out what the optimal problem difficulty to practice is, and to better understand the relationship between practice and contest performance.


Very interesting
Well done! Do you guys have a plan to make a small service where people can see dynamically updated problem list and statistics. That would be super awesome!
Thanks! Making a web app that allows people to keep track of problem ratings for problems they've solved is definitely on our to-do list. Let us know if there's anything specific you'd like to see!
Any updates on web service ? Also one specific thing that I would like to see is for a given user an average of all the problems solved by him for a particular category / tag like dp.
Thanks a lot for your suggestion, I really like that idea.
Things are going a bit crazy at the moment with work (I'm a graduate student, gotta submit those papers), but this is at the top of my list. We'll post again when it's in a usable form!
I just finished writing scripts to create a really barebones profile so everyone can see what their rating profiles look like. They can be found here. We will eventually rewrite this in javascript to make it less ugly and add more functionality, but hopefully this helps!
Guys, how is your progress? We are looking forward to seeing the app.
I just finished writing scripts to create a really barebones profile so everyone can see what their rating profiles look like. They can be found here. We will eventually rewrite this in javascript to make it less ugly and add more functionality, but hopefully this helps!
Awesome! Is their any way for us to do the same thing that you showed with I_love_Tanya_Romanova's rating graph?
It would be pretty interesting to see :)
We only have an iPython notebook to do this here for now since the visualization part is happening in R. Hope to have something better soon. :)
Cool, so I can download iPython/R to run those? I'm just interested in seeing how it looks for my account. Or maybe you could run it and post a picture here? :D
Nice graphs, but some of that ("categories of problems") has not enough resolution and quality.
Can you update resolution or give full-size version? Or change jpg to png, please?
Unfortunately we did save it as a pretty high-res png, but codeforces compressed it to the state that it is currently. The low res version is really hard to read, I agree :(
I just pushed the png files in this blog post to our github. The categories plot in particular can be seen here.
Can't read the text on some graph.
Codeforces compressed the images unfortunately. High res versions of the plots can be found on our github.
I apologize if my question is stupid but I want to know if the rating depends on the results of only official contest or also of virtual ones and problemset standings ... ?
I think it depends on virtual ones also.
Lol, it doesn't depend on virtual contests.
That's a good question! The rating depends only on the official contest. This means that all the data we have is controlled for the same amount of time allotted, no prior knowledge of problems, etc. People doing virtual contests might already know some problems. People doing problem sets have unlimited time and can copy and paste. We don't want these factors to mess up our results.
Auto comment: topic has been updated by chenmark (previous revision, new revision, compare).
Hello guys! How is your project going? I would really like to see your app. Do you need any kind of assistance?
Thank you so much!
nvm, wrong blog page :)