So, I scraped stats.ioinformatics.org for some data to estimate the correlation between CF rating and place you get at IOI. I guess many will find these plots interesting.
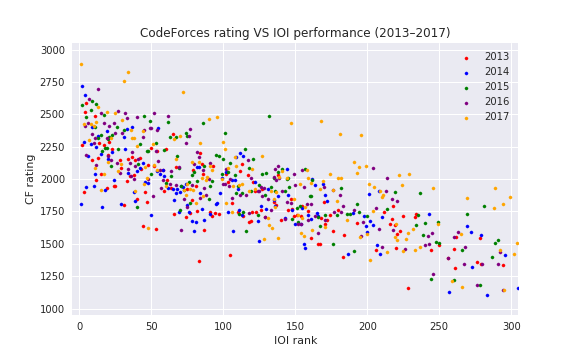
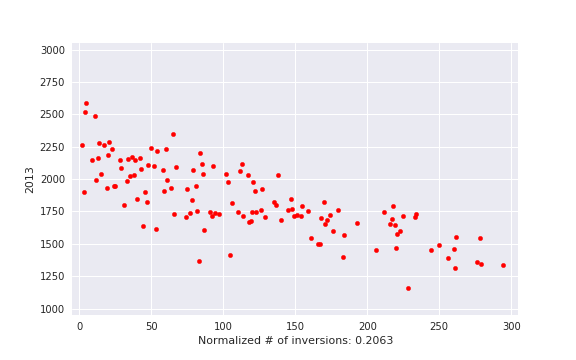
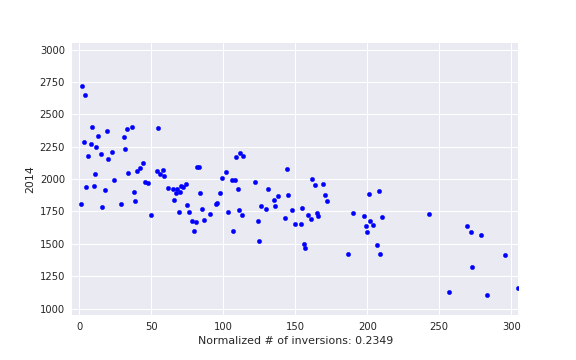
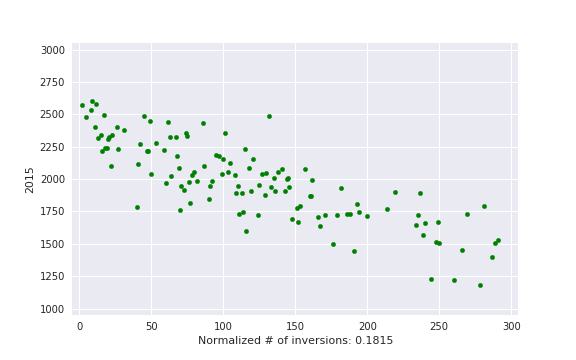
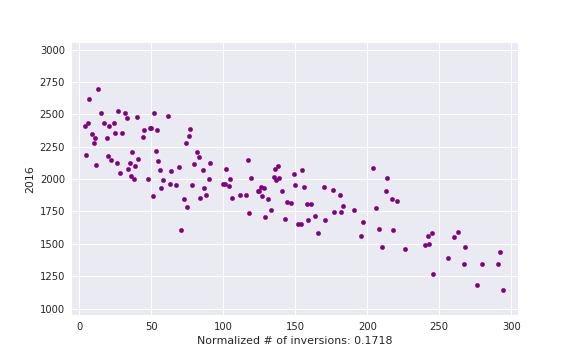
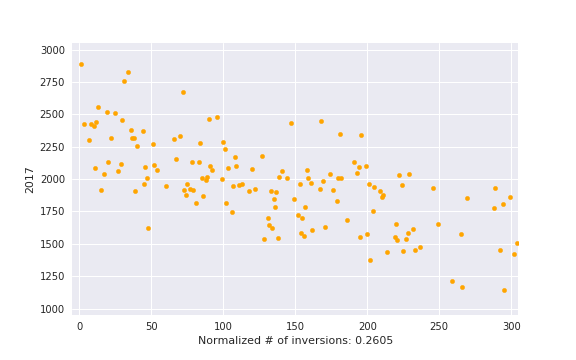
I only considered contestants who had ≥ 5 rated contests during last 2 years before 1st of August of the relevant year. Years 2013-2017 had more than 120 such contestants, but IOI '12 had only 55 and earlier IOIs had even less, so I didn't go any further.
By "normalized # of inversions" I mean this:  , i. e. actual number of inversions divided by maximum possible. This is some kind of measure of a contest being close to a standard CF round.
For more details, check out the code: https://gist.github.com/sslotin/ae9557f68bb7e7aea1d565e2229a81c9


it is uninteresting
It's interesting how the points are scattered in the graph from 2017. I think it's because of that problem.
Wew. The same rank at IOI has rating spread around 750, which is about 3-4 different titles/colours. That's comparable to σ of CF rating distribution (I'll ballpark it at 300).
We can see from the graphs that the average CF user (rating 1500) has a decent shot at anything from bronze to nothing and a barely div1 contestant (rating 1900) has a shot at anything from gold to nothing.
p-value?