


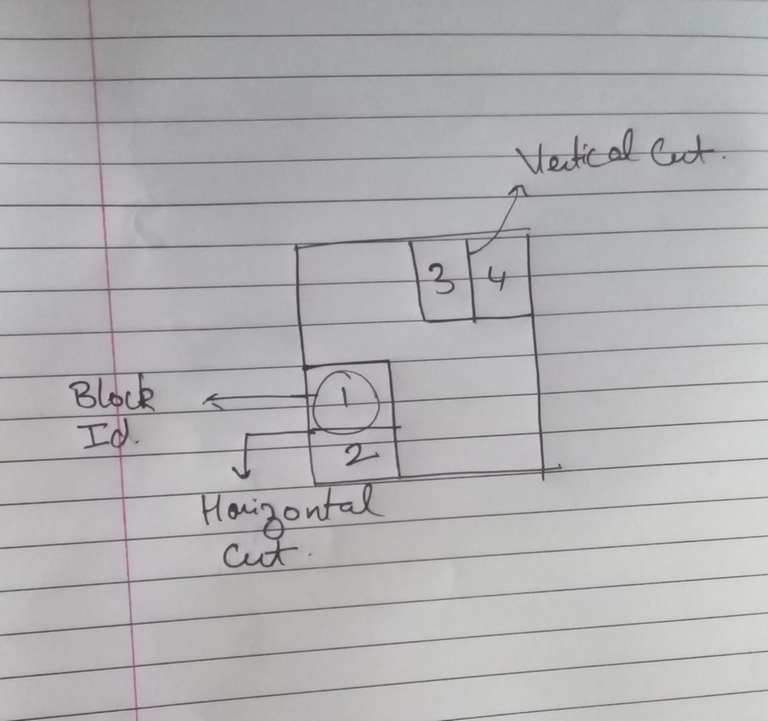
The info I am given : block_ID, block_width, block_height as well as how the cuts between the rectangles are(horizontal or vertical); for example two rectangles can be joined by a horizontal cut or a vertical cut. See above picture for greater clarity(H symbolizes horizontal cut and likewise V for vertical cuts). The order of cuts on the blocks can be represented as a normalized polish expression or a skewed binary tree.
What i tried till now : I tried using a stack based approach where I would push the digits in the polish expression into a stack and would pop the top 2 elements from the stack when I came across a character(H OR V) and then join these 2 blocks (take max of height and add the widths for vertical cuts and vice versa for horizontal) and push this new 'edited' block into the stack again.The issue arises when I try to join the plots of 2 different subtrees.
Code for the same :
def plot_floorplan_area(blocks, polish_expression,num_blocks):
    # Initialize the plot
    curmax=num_blocks
    fig, ax = plt.subplots()
    ax.set_xlim(0, xmax+5)
    ax.set_ylim(0,ymax+5)
    ax.set_xlabel('Width')
    ax.set_ylabel('Height')
    ax.set_title('Floorplan')
    x, y = 0, 0
    stack=[]
    for c in polish_expression:
      if c.isdigit():
        stack.append(int(c))
        c=int(c)
        c-=1
        curwid=blocks[c][1]
        curht=blocks[c][2]
        left_bottom=(x,y)
        rect = Rectangle(left_bottom, curwid, curht, linewidth=1, edgecolor='r', facecolor='none')
        center_x = left_bottom[0] + curwid / 2
        center_y = left_bottom[1] + curht / 2
        ax.text(center_x, center_y, str(blocks[c][0]), ha='center', va='center', fontsize=12)
        ax.add_patch(rect)
      elif c=='H':#horizontal cut.
        el1=stack.pop()
        el2=stack.pop()
        el1-=1
        el2-=1
        curwid=max(blocks[el1][1],blocks[el2][1])
        curht=blocks[el2][2]+blocks[el1][2]
        rect = Rectangle(left_bottom, curwid, curht, linewidth=0, edgecolor='none', facecolor='none', alpha=0)
        x+=curwid
        y+=curht
        curmax+=1
        stack.append(curmax)
      elif c=='V':
        el1=stack.pop()
        el2=stack.pop()
        el1-=1
        el2-=1
        curht=max(blocks[el1][2],blocks[el2][2])
        curwid=blocks[el2][1]+blocks[el1][1]
        rect = Rectangle(left_bottom, curwid, curht, linewidth=0, edgecolor='none', facecolor='none', alpha=0)
        x+=curwid
        y+=curht
        curmax+=1
        stack.append(curmax)
    plt.grid(True)
    plt.show()
Structure of a row of the blocks matrix : {ID,width,height,area} .
Could anyone tell me alternate approaches/corrections to the existing approach as this one is yielding wrong outputs.
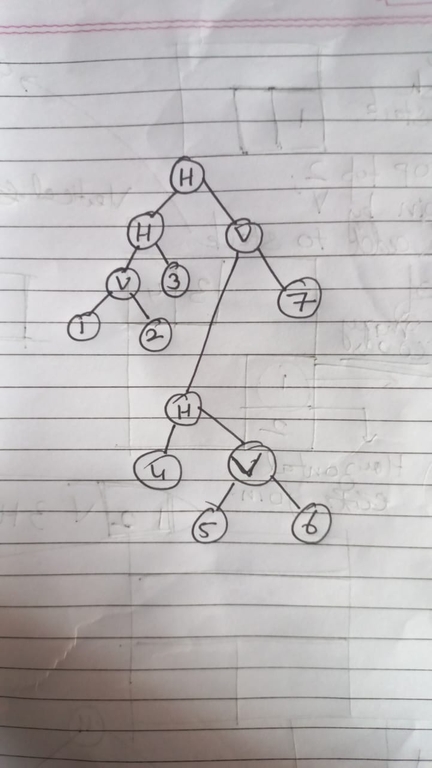
Example of a polish expression : 1 2 V 3 H 4 5 6 V H 7 V H. It is basically the post order traversal of the above tree.
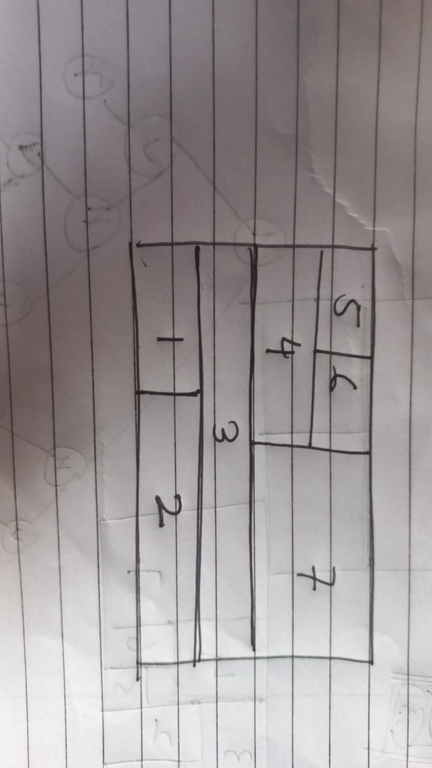
This is what the final floorplan should look like.


