In this post I'll try to expose the results of my research regarding the rating formula. More specifically, I'll show a graph that gives you a rating according to your performance and I'll show the basic aspects of how ratings are updated. This post is quite large, if you are only interested in the results you can easily skim through it :)
Disclaimer: I'll try to support my assumptions and assertions with data but, altough I have done the analysis carefully, I may have done a mistake :) Moreover, take into account that some of my formulas are approximations.
Motivation
Almost two years ago I started to participate in contests more actively, aiming to be red one day. To increase my motivation I tried to find a formula that evaluated how well I did during a competition. At that time there were no API nor DmitriyH's statistics so I manually looked at a lot of profiles to try to find 'stable' points: users that didn't change their rating after a competition. Supposing that, in that case, they performed as they were expected; I obtained two approximate linear formulas for Div-1 contests:


The 1st formula was a good approximation, but started to fail roughly for red performances and the second one worked pretty bad; but they gave a good idea of how the match had gone. With this I did an Excel like this one:

As you can see the colours in the left look much more interesting than the colours on the right. As months progressed I saw that this formula was helping me and could help others as well, so, as an extra motivation, I promised myself that when I first turned red I would do a serious post about it (and also write a CF contest for both divisions (separately), if they allow me :) ). I may not be red when you read this post; but,anyway, here it goes!
Theoretical analysis
ELO system and expected rank
The basis of my work is MikeMirzayanov's blog, along with some others. In CF, the probability that A wins B in terms of their rating is:

Now, if we run all the possible matches between the contestants and add the probabilities of winning against every competitor we get the expected rank (+0.5 because ranks start with 1 and the probability of winning against yourself is 0.5):

This formula also shows that (obviously) your expected rank does not only depend on your rating, but also on your competitors. However, as I'll later show, for most participants this will not matter. Another thing that can be observed is that the relative position of your competitors will not affect your rating: in other words, it doesn't matter if you beat a red and a blue beats you or you beat a blue and the red beats you.
Notice that expected percentile is a very similar formula dividing by the number of participants and subtracting 1 or not depending on if you count yourself.
The theory of the ELO system suggests that, after a match, ratings of A and B should be updated by a constant multiplied by the difference between the expected result and the actual result. For instance, if the constant is 14 and the guy with the probability of winning of 0.7 looses, his rating will decrease by 14*(0-0.7) = 9.8. We can't do this in CF because competing against 600 coders in a single contest isn't the same as competing in 600 individual contests with each one of them: results are much more variable in the former case. Thus, we'll have to think of another update rule that takes this into account; more on this at the end of the blog.
Volatility and other assumptions
Topcoder uses similar ideas, but also has volatility assigned to each user. Looking at worse's or dreamoon_love_AA's profiles made me think there was no such thing in CF (because their ratings movements have no acceleration). Topcoder also takes into account the number of contests done, I believe CFs doesn't do it. I'll try to show more evidence of this below.
In my analysis I'll also assume that the rating formulas didn't change (which probably did, but not much).
Results
Codeforces API
To obtain the exact formulas I needed to obtain much more data; thus, I turned to Codeforces API (thanks a lot Codeforces admins for creating it!) I had no idea about APIs and almost no idea about python, but I found soon's blog, which was incredibly useful; you should check it out!
With this I wrote a code to obtain the Rank, OldRating, NewRating (and other data) for every user competing in a contest and then analyzed the results on Matlab.
One of my objectives was to find the formula to update ratings. I used slightly old data to obtain the models and reserved the recent data for testing if the models were correct. Thus, the data has been obtained using slightly old contests (350 to 450, we're at 550 now). Some things may have changed slightly, but not that much.
Rating distribution of users in a contest
Here are the rating distributions for the 3 types of contests. Rating 0 is for new participants. I have averaged several contest, but they don't change much from contest to contests. Finally note that they are not equivalent to rating distributions of all users in CodeForces since some users with some ratings participate more often than others.
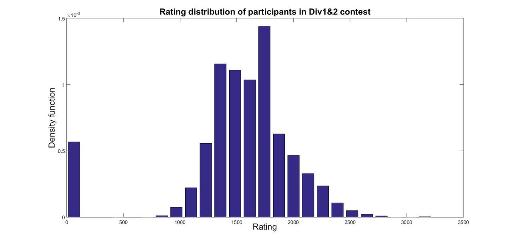
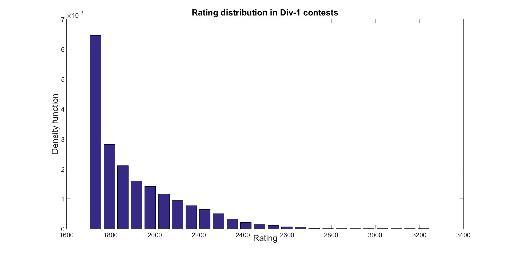
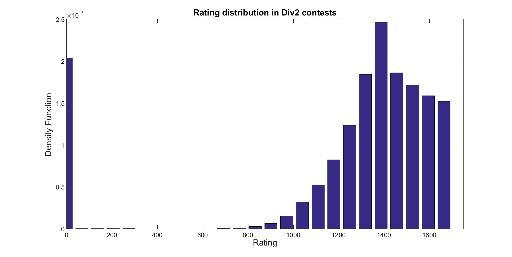
Rating Inflation
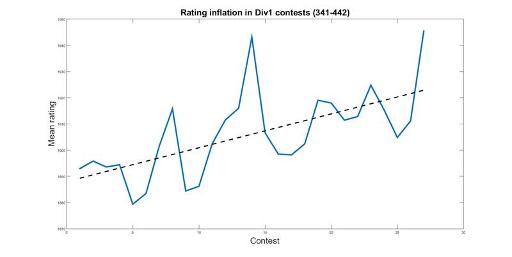
Accidentally I also found what I believe to be evidence of rating inflation. Notice this is slightly old data, it's probably better now :) This is the mean rating of participants in Div1-contests:
Evaluating the performance in a contest
Now that we have the rating distributions, and we know they don't change much, we can relate percentile to an equivalent rating using the formulas from theory. For a given percentile, its equivalent rating is the rating that (according to the formulas) would give that percentile as the expected one.
The following graphs are very exact for the linear section in the middle (where the Law of big numbers applies and every contest is roughly the same); there, the width of the pen is bigger than the variations between contests. Variations are larger on the extremes: for instance, the equivalent rating of the first places is greatly affected by tourist's or Petr's presence.
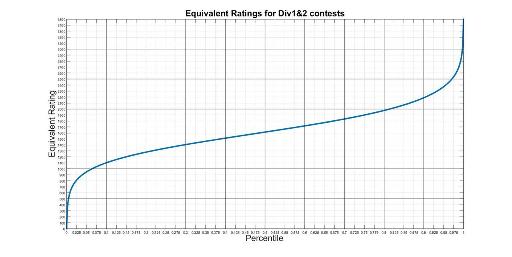
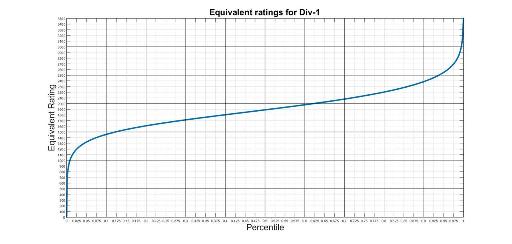
If you want to check particular percentiles with more detail, you can take a look at this Google Docs excel.
Rating updates
The formula for rating updates turned out to be a nightmare to reverse-engineer and, in fact, I failed to do so. Luckily, my wonderful girlfriend mariabauza helped me find patterns and observations that we believe are insightful and useful!
We can make a 3-D scatter plot of Rating Increase vs Old Rating and Perfomance = MatchRating-OldRating; where MatchRating is what we calculated in the previous section. This turns out to be a surface (it could have been a cloud/volume); therefore, we can be sure that we only need those 2 parameters to make the update! (This confirms the fact that volatility nor number of contests are taken into account). The updates for all contests have roughly the same form; though the parameters of these forms are vary slightly (probably due to the number of participants and number of new participants). Here's the surface for Looksery cup:
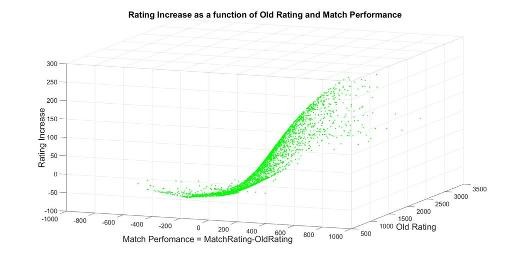
Making the 2-D plots separately gives a clearer idea:
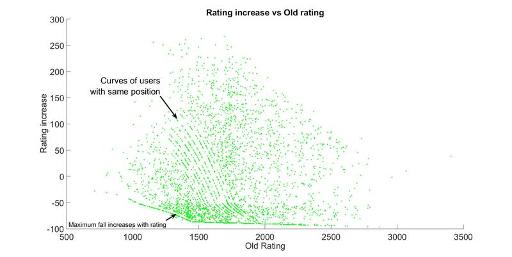
In this graph we observe that rating increase correlates negatively with OldRating; which actually makes sense; it makes the hole system stable. We don't know if this is somehow directly helped from the design of the rating formulas or a consequence of regression towards the mean.
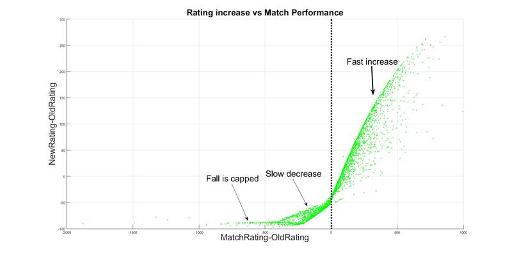
In this plot we see that rating increase almost only depends on the difference between what's expected from you and what you actually did. This difference is calculated in terms of rating, not positions (the difference between 1st and 2nd is much more important than 439 vs 440).
Notice that if you perform as you are expected, your rating actually decreases; which we already knew it was done to prevent rating inflation. Moreover, this point separates two regions: above it your rating change rapidly increases while below it the fall is slower. Both changes are quite linear, though after some point they start to curve and converge. We've tried to fit them both with powerlaws and rational functions; both fittings pretty well (however, when we try to fit everything with a function depending on both coordinates it doesn't work very well). Finally, if you perform really bad there's a maximum fall, which is usually around -100 (and it depends on your rating, as we'll se in the next graph).
For a given OldRating, the relationship between RatingIncrease and MatchPerformance always has these three regions, but for highly rated coders the curves are more curved. That's why RatingIncrease doesn't only depend on MatchPerformance.
I hope you enjoyed the analysis!


