areo's blog

By areo, history, 4 years ago, In English

td,dr: A 1100, B1 1300, B2 1800, C1 2000, C2 2300, D1 2200, D2 2700. You needed a 2300 rating to have more than 50% prob of winning a t-shirt and advancing to round 3.

GCJ round 2 took place last weekend. Congratulation to everyone who won the t-shirt and advanced to round 3.

I provide below my estimate of the difficulty of the problems. This is a bit late, and I skipped round 1B and 1C, but I will do a summary of round 1 to catch up.

The data and methods are the same I described in my previous posts, see qualification round and round 1A.

Your feedback is very valuable to increase the quality of the estimates and is very appreciated.

Method 1: The 50% Bucket

Approach and Data

Please see my previous post for an explanation.

Out of around 4'500 participants of GCJ 2, about 2'900 had a CF namesake.

I decided to exclude from the estimate roughly 30 participants with rating below 1000. If you made it this far, your rating doesn't really reflect your ability, so your performance is not a good indicator of the difficulty of the problems.

I also grouped the other participants below 1300 in a single bucket, since there aren't many left.
Results

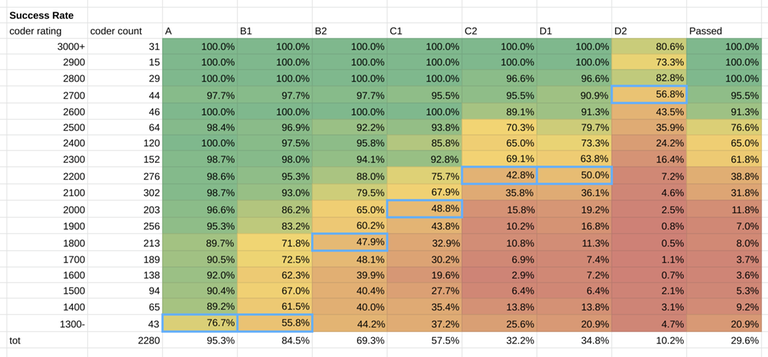
This is the estimate: A 1300, B1 1300, B2 1800, C1 2000, C2 2200, D1 2200, D2 2700.

I think this approach gives reasonable results for most problems, with the exceptions of A and B1. Those two were easy for the majority of the contestants, so this method just places them at the lowest bucket available.

Method 2: Inverse Prob Function

Approach and Data

Again, please see my previous post for more details.

In this round, the average contestant rating was 2020. I tried to imply the difficulty of the problem given the success rate of the contestants close to the average ability ($$$2000 \pm 100$$$ rating), and the results... well, did not improve the estimate by much.

Results based on average contestant's performance

A 1397, B1 1655, B2 1860, C1 1967, C2 2222, D1 2190, D2 2619.

As observed for previous rounds, the approach of inverting the prob function doesn't work well for problems very easy or very difficult for the contestant. For example, the difficulty of B1 is clearly inflated with this approach, and we weren't able to place A at a reasonable level below the 1300 bucket.

Given that the previous buckets method already gives decent results for most problems, can we really learn anything more about the difficulty of the problem using this approach?

I think so. For the easiest and hardest problems, the buckets don't work well. There are not enough contestants around 1000-rating to make enough buckets to estimate the difficulty of problem A. But we can estimate the difficulty of A and B1 based on the performance of the lowest-rated participants. For the hardest problems the buckets seem to work fine so far, but maybe in the coming rounds there will be a similar issue for them.

Adjustments to easy problems based on low rated contestant performance

There are roughly 200 contestants with rating <= 1500. Based on their performance:

A 1,068, B1 1,309.

Much more reasonable.

My Estimate

I put together the two estimates above, and I get this:

A 1100, B1 1300, B2 1800, C1 2000, C2 2300, D1 2200, D2 2700.

What rating did you need to be to pass the round and win a t-shirt? 39% of coders rated 2200 qualified for Round 3. The percentage increases to 62% for 2300 rated participants. You needed to be a Master/close to International Master to have a significant chance to pass. In the table above, right-most column, you can see more details.

What do you think?

Full text and comments »

  • Vote: I like it
  • +112
  • Vote: I do not like it

By areo, history, 4 years ago, In English

td,dr: A1 800, A2 1500, B1 1500, B2 1700, B3 2000, C1 1900, C2 2100, C3 3000. You needed around 2000 rating to have a 50% prob of advancing to round 2.

Hi everyone. GCJ round 1A took place yesterday. If you didn't participate, you may be wondering how hard it was, and what are your chances to pass round 1B or 1C and qualify for round 2.

I provide below my estimate of the difficulty of the problems. The data and methods are the same I described in my previous post. I am sure there is room for improvement, so again I welcome any feedback.

Method 1: The 50% Bucket

Approach and Data

Please see my previous post for an explanation. In short, I use the fact that you have a 50% probability to solve a problem with difficulty equal to your rating. I divide the contestants into buckets of rating, wide 100 points, and I check for which bucket 50% of the coders solved the problem.

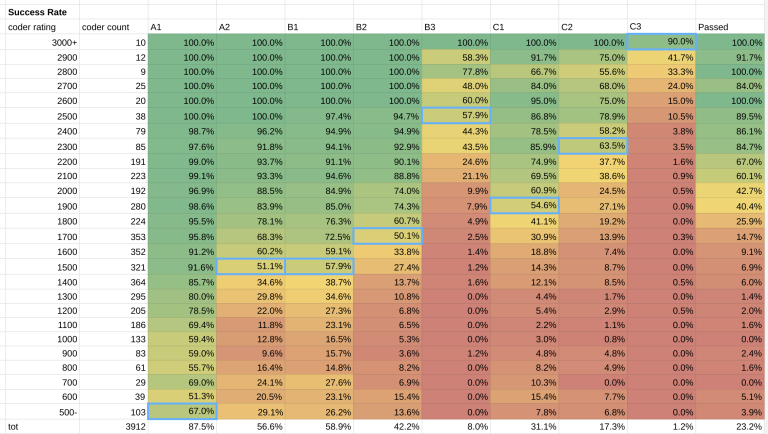
Out of around 10'000 participants of GCJ 1A, 3'915 had a CF namesake. I cleaned up a few obvious outliers, and the results are below.

Results

This is the estimate: A1 500, A2 1500, B1 1500, B2 1700, B3 2500, C1 1900, C2 2300, C3 3000.

I think this approach is now working better than it did for the qualification round. One possible reason is that this time everyone tried to solve every problem, differently from the qualification round where there was little incentive to solve everything.

However, one problem persists: among lowly rated participants there are coders performing very well, maybe too well, for their rating. These may be new accounts of seasoned coders. The high percentage of low-rated coders who solved A1 shrank its estimated difficulty. Was it really a 500 difficulty problem? Maybe it was something more.

Method 2: Inverse Prob Function

Approach and Data

Again, please see my previous post for more details. In short, CF rating system assumes that your chances of solving a problem are a function of your rating and of the problem difficulty, see here.

We can invert the probability function to estimate the problem difficulty: $$$D=400 \cdot \log_{10} \left( \frac{1-p}{p} \right) + R$$$

where $$$R$$$ is the rating of the participants I am considering, and $$$p$$$ is their probability of solving a problem, estimated with the percentage of participants who actually solved it, and $$$D$$$ is the estimated difficulty.

In this round, the average contestant rating was 1594. I used the rating buckets around the average, from 1500 to 1700. This includes about 1000 contestants.

Results

This is the estimate: A1 1154, A2 1529, B1 1505, B2 1689, B3 2299, C1 1825, C2 1981, C3 2804.

The results are fairly in line with the previous method, which is a good sign. The two biggest differences are these:

  • A1 has a much higher rating now, around 1100. My impression is that the approach of inverting the prob function doesn't work very well for difficulties far away from contestants' rating. I do some average between the two estimate methods to adjust for it.

  • C2 difficulty dropped from 2300 to about 2000. Which one is more accurate? My personal impression is that 2300 is a bit too much, but I welcome your input here.

My Estimate

I put together the two estimates above, and I get this:

A1 800, A2 1500, B1 1500, B2 1700, B3 2000, C1 1900, C2 2100, C3 3000.

What rating did you need to be to pass the round? Well, 43% of coders rated 2000 qualified for Round 2. The percentage increases to 60% for 2100 rated participants. You needed to be about a Candidate Master to have a significant chance to pass. In the table above, right-most column, you can see more details.

What do you think?

Update based on feedback

  • Lowered B3 from 2400 to 2000.

Full text and comments »

  • Vote: I like it
  • +246
  • Vote: I do not like it

By areo, history, 4 years ago, In English

td,dr: A 900, B1 1000, B2 1100, B3 1300, C1 1200, C2 1400, D1 1600, D2 1700, D3 2200, E1 1800, E2 2100.

Have you been wondering what is the difficulty of Code Jam problems on a codeforces scale? me too.

I made an estimate for the 2021 qualification round (link), and I plan to do it also for the upcoming rounds. This is the best estimate I came up with, but I am sure it's possible to do better. I share here the process and the results, and I welcome any feedback.

Data

I use two data sources:

  • CJ contest result data, downloaded using vstrimaitis code, see details in his great blog post. From here I get the list of contest participants and what problems they solved.

  • CF users data, downloaded using CF API. From this, I get the current rating of every CF coder.

I assume that many coders use the same username across different platforms. If for a given CJ contestant I find a CF user with the same name (case insensitive), I assume they are the same person.

I assign to each CJ participant the rating of the corresponding CF coder, and I discard all other participants. This filter may introduce some bias, but I don't see better solutions.

Difficulty Estimation 1: The 50% Bucket

Method

The formula used by CF to determine the difficulty of a problem is not public. However, the main idea is that you have a 50% probability of solving any problem with difficulty equal to your rating. Some details here.

I divide contestants into buckets wide 100 rating points (a 1450 and a 1549 coders fall in the 1500 bucket), and I see what bucket had a 50% rate of success. That's my estimate of the difficulty of the problem. I group together all ratings above 3000 and below 500, or the sample size would be way too small.

Results

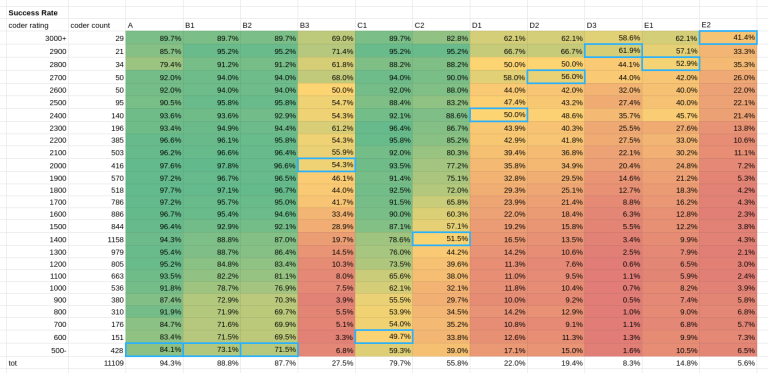
Out of the 37,398 contestants who submitted something during the qualification round, 11,109 have a homonym CF user. Here their success rate on the different problems:

Estimated Difficulty:

A <=500, B1 <= 500, B2 <= 500, B3 2000, C1 600, C2 1400, D1 2400, D2 2700, E1 2600, E2 3000.

Issues

Difficulties don't look right. B3 is a simple dp problem, definitely not 2000 difficulty. What is going wrong then?

One obvious issue is that I am matching profiles across platforms using the username, which is probably introducing noise. But I don't see much better options.

Another big issue is that many contestants didn't seem to care about solving all the problems. See LHiC for example, an international grandmaster who just solved problems E1 and E2. My guess of what is happening: since this is a qualification round where you only need a certain sum of points to pass, many people just thought that solving all the problems wasn't worth the time. This lowers the problem success rate and inflates the difficulty.

Difficulty Estimation 2: Inverse Prob Function

Method

For this round, I want to exclude from my estimation the data for top coders, who didn't bother solving all the problems. Bottom contestants also come with some issues. For example, some low-rated contestants seem to be just the new profile of a seasoned coder, so we can see coders with a rating below 1000, few CF contests, but who solved all the problems.

If I exclude all this data, I can't apply the bucket method above anymore, since for many problems there is no rating bucket who had a 50% success rate. What can I do with the remaining average coder data?

Well, according to CF rating system, if your rating is R, and the difficulty of a problem is D, then your probability of solving it is $$$p=\frac{1}{1+10^\frac{D-R}{400}}$$$.

We know the contestants rating, their rate of success, so we can estimate the difficulty of the problem by inverting the formula: $$$D=400 \cdot \log_{10} \left( \frac{1-p}{p} \right) + R$$$.

I decided to look only at contestants around the mode of the rating distribution, $$$1400 \pm 100$$$. This leaves about 3,000 contestants.

Results

Below the difficulties I obtained with this method:

A 878, B1 1020, B2 1050, B3 1634, C1 1158, C2 1395, D1 1682, D2 1727, D3 1968, E1 1784, E2 1979.

This feels more reasonable to me.

I do some further rounding, in some cases arbitrarily up or down where I felt it was needed. For example, D1 1682 and D2 1727 would both fall on 1700, but they are definitely on a different level, so I round the former down.

Adjustments

Thanks for the feedback, practicener and Ahmadsm2005.

I lowered B3, to be below C2. Probably the fact that it was worth only 1 point during the contest resulted in many coders skipping the test, lowering the success rate and inflating the difficulty.

I also increased E2 to 2100 and D3 to 2200. The approach of inverting the prob function doesn't seem to work very well for difficulties far away from the rating of the contestants I chose as a reference, 1400.

Final Estimate

A 900, B1 1000, B2 1100, B3 1300, C1 1200, C2 1400, D1 1600, D2 1700, D3 2200, E1 1800, E2 2100.

What are your thoughts?

Full text and comments »

  • Vote: I like it
  • +85
  • Vote: I do not like it